This amazing app lets the urban Motorcyclists share their passion

Today, a typical biker in India, is a man in his 30s, who works in a multinational corporation and is looking to find an outlet for his increasingly global ambitions.

I researched and designed this app to allow these weekend bikers to plan their trips, create their ‘gangs’ and make new friends.


Note: Because of the non-disclosure agreement, some of the information on this page has been replaced with fictitious ones or has been blurred out

Planning

Plan biking trips and invite your friends.

Quick Trips

Let the app suggest you some nearby places for a quick trip.

real time location

Locate your friends on the move.

gangs

Meet new bikers and invite them to form your gang.

The necessity!

What was the motivation to create this app?

The Indian motorcyclists have only a weekend to drive their high-end bikes.

These bikers need to plan the trips and there are no dedicated tools on the market that allow this.

Royal Enfield is the most popular bike in India. While its comparatively lower price may be a contributing factor, the old world charm of a large single-cylinder engine and the vibrations of a traditional chassis have kept many loyal to the classic Enfield, and it remains the favourite for long journeys on Indian roads. Picture courtesy: Rahul Dhankani

Who is the user

Building a persona from the user interviews

Who are Indian bikers?

Indian bikers have:

1. A great job in IT companies

2. Have a nice disposable income

3. An unending passion for riding bike

4. Only a limited time on weekends to explore their bikes.

Talking with the users

Understanding what the bikers need

“Some of the best friendships are made on two wheels!”

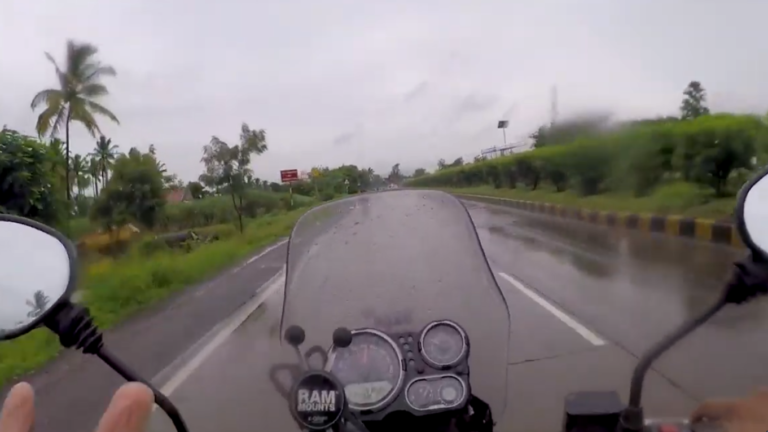
I work 5 days a week in an IT company. I get to ride my bike only on Saturdays and Sundays. I have only a limited time, so I prefer to make the most out of it.
Renjith Peter
28 years, IT Professional
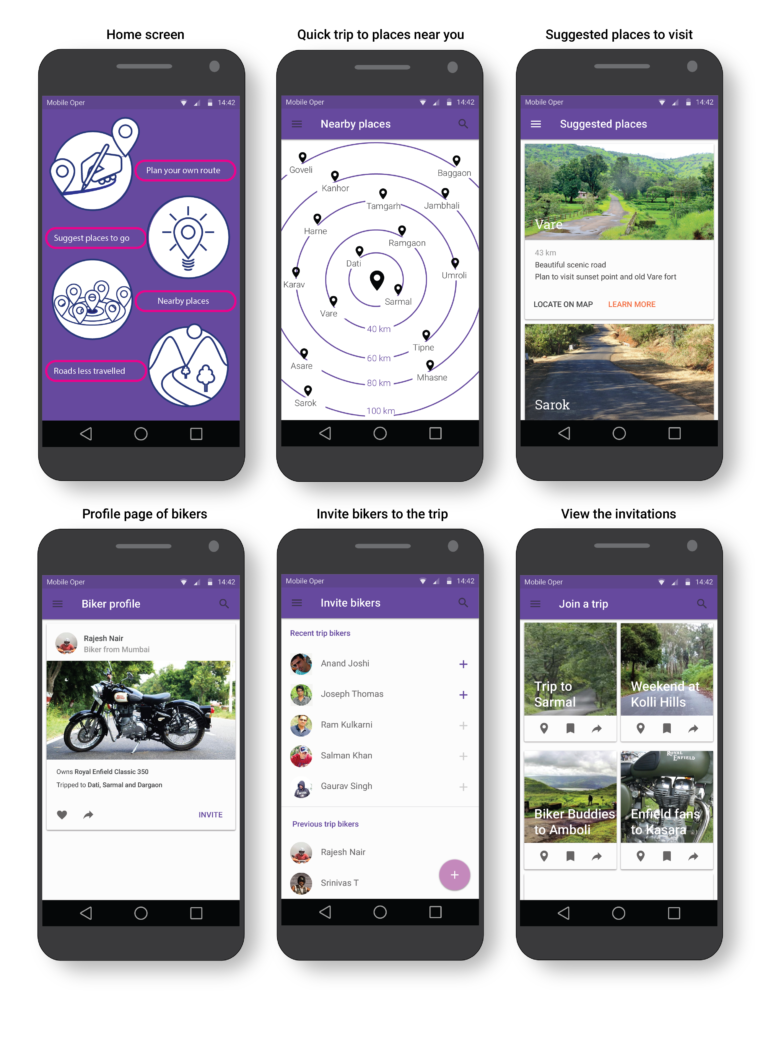
I like to go on long drives with my friends. Right now, we plan our trips using WhatsApp. It's difficult to text all the time and share all the stuff with everyone.
Nikhil Sapre
26 years, Manager
I have explored almost all the routes around my city. The real challenge is finding new routes using Google Maps. Also small service stations are missing from the Maps.
Nilesh Kumar
31 years, Tech Support

What data to gather?

Pre-research preparations

The choice of research method
Before anything is designed, research into the current problem was carried out. There are many methods for collecting the information from the field. The kind of data decides the method used for collecting it.

What data was needed?
An insight into the requirements and behaviours and habits of the bike riders who otherwise work in IT companies and ride only on weekends.

1. Bike riders have a kind of dual personality. They are timid and simple folks on the weekdays, while on weekend their rough side turns up.
2. They use some really different language and words that are specialized in their own groups and requires some unique understanding.
3. They spend huge amounts of money to buy, customize and ride out their bikes over the weekends. This impacts the other priorities in their lives. The effects of these needs to be found out.
4. They are very possessive and peculiar about the way they present themselves, hence their needs are very specific.

Ethnographic research

Collecting the data using ethnographic research

Biking is a highly specialized hobby with even specialized equipment
Why ethnographic research?
1. The domains, goals and the context of use of this app require deep understanding of the users.

2. The data collection about the social phenomenon of biking was more important than validating the need for this application.
3. The biker community has very strong culture and style requirements, which are not found in other user groups.
4. A short ethnographic research can uncover highly complex requirements in the beginning of the project.


Time and budget constraints:
Normally, ethnographic research requires a lot of time and money. However, short ethnographic research can be very useful for building user centered projects such as this one.
Time: Two weekends. Spent with the bikers.
Budget: Limited budget spent on a Go-Pro camera, so that data can be collected on the move.

equipment for research

Carrying out the research and collecting data

Helmet mounted Go-Pro camera used for data collection on the trip
  1. Inquiry into how the bikers currently plan their trips. Direct inquiry was necessary since some of the calls and messages were not directly observable.
  2. Observation of how the bikers actually plan the trip. I request two bikers to allow me to observe how they planned the trip using phone calls and messages.
  3. Observing on how the meeting took place, their specialized language and gestures.
  4. Accompanying the bikers on the trip and observing how they use the signals such as lights and horns over distance to communicate with each other.
  5. Recording the details of the trip using the camera.
  6. Observing how they obtained information regarding road and the weather from other bikers.
  7. In the first weekend, I accompanied the bikers as a pillion passenger, while on the second weekend, I took my own bike as part of participatory research.

Observations

Recording the findings

Example of mobile phone mount on one of the motorcycles.

Context

Three distinct phases: pre-trip, during trip and post trip.

Actors

Tracking of positions of teammates is a problem.

Activities needing assistance

Pre-trip: Planning the trip, checking the availability of participants, inviting new people, checking condition of bikes, stocking on provisions and food, making booking if needed, ensuring enough sleep.
During trip – tracking team mates, signaling to others
Post-trip – Analysis of trip, sharing photos.

Objects

Most bikers are equipped with cell phones with holders, backpack and other safety equipment.

Enjoyable Acts

– Driving with each other,
– Stopping for clicking photos
– Enjoying the local food.
– Sometimes they stop if there is trouble with bikes.

Turndowns

– Cancellation of trips,
– Bikers not turning up for the trips,
– Not enough new bikers,
– Not being able to locate stops,
– Bike issues,
– Incorrect information about the roads,
– Harsh weather

Special Events

– Celebration of birthdays,
– Bike anniversaries,
– Party for new bikes

Sequence of actions

This was captured as user journey.

Goals

– Getting maximum enjoyment in limited time.
– Meeting new people
– Sharing experiences
– Enjoying new places and foods

Current user flow

Method the bikers currently use to plan a trip

User flow diagram showing the process used currently by the bikers.

Mapping the voice of user to features

Requirements mapping

What-users-want translated into features

mapping

Arranging the information

Information architecture 

Creating the flow of the app and interweaving the features

The information architecture shows which information comes where and how the user will navigate.

The information needs some hierarchy so that user can navigate through the different features in a logical and seamless manner. This is why an information architecture was created. 

Concepts 

Creating concept screens for the app

In order to plan the screens and the information flow in an appropriate manner, first concept wireframes were drawn by hand.

The hand sketched wireframes paved the way to analyzing and refining of the ideas.

Interaction diagram 

Capturing ‘what happens when I tap …’ interactions

It becomes easy for the user, if the designer plans out ‘what happens when … ‘ scenarios. Using interaction diagram, all the features were effectively captured to a great detail.

Task flows 

Understanding how the users will accomplish some of the key tasks

I tried to capture some of the tasks which the users need to do often and created wireframes to show how they will accomplish it.

Creating a new trip
inviting bikers
accept

ERGONOMICS 

Safety of using the app while driving

Suppose one of the biker runs into a problem, she/he can alert the other bikers.

Design challenge: While the bikers are driving their bikes, they will be only be able to see their mobile phones. This is a safety concern as it might distract the biker.

Solution: Selecting the correct letter size is important as it will dictate whether the biker can see the alert or not. Only a simple alert would be shown instead of detailed information. This would force the biker to stop and use the app.

Distance of mobile phone from the eyes of biker used to determine the font size for alert screen.
Biker app - screens-02
This is how the normal screen and alert screens appear during bike ride.

Visual designs 

Creating appealing visual designs

A good looking design is created for the user. What looks good, appears friendly to the user.

Some of the imprtant screens of the app.

Loading Animations.

Some loading animations were designed to engage the users.

Loading animation for 'Locate nearby places'
Loading animation for 'Plan your trip'
Loading animation for 'Roads less traveled'
Loading animation for 'Sggested places'